
AB experiment - User experience
AB test - User experience
I worked on this project for a recruitment process I was involved in in Spring 2020. The task was to analyse the results of an AB experiment run within a fictional Free-to-Play mobile game. The AB experiment was designed to test two different game versions, the original A and a new version B. The details of the experiment:
- Duration: 04.05.2017 - 22.05.2017
- Number of observed players: 10,331,056
- Group A is the control group and received the original experience
- Group B is the treatment group and received a different experience than normal
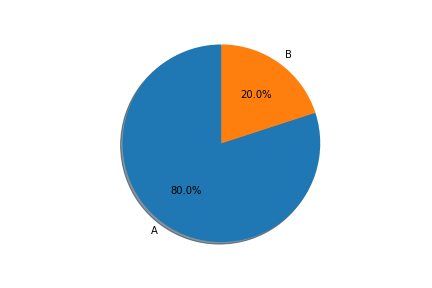
- Group split was random: 20% of users were assigned to group B and 80% were assigned to group A
- The goal of the analysis was to provide a recommendation for product managers on which version provides the better experience to users.
Data
The data was provided through Google BigQuery and contained information on user-level. Next to activity data, such as number of game rounds played, purchases made or date of install, also experiment specific data was provided containing group assignment and time of assignment.
Metrics of interest
Since the goal of the tasks was to make a recommendation on the user experience, I firstly focussed on the metric avg_gameends (defined as average number of game rounds). However, for economical reasons, I then also looked at sum_of_purchases and conversions to detect statistical differences between both versions.
Methodology
As a first step, I ran a quick Exploratory Data Analysis followed by a sanity check to make sure users were randomly assigned and statistically indifferent before the start of the experiment. For this, I ran a z-test on the metric avg_gameends with pre-experiment data. I chose the z-test because the dataset provided was large, the distribution of the means (computed from samples) can be assumed to be approximated by a normal distribution and variance is known.
In a second step, I ran the z-test again to determine whether the two experiences were statistically different while the experiment was live. Also, I tested whether the results were still holding when removing outliers.
H-0: The average game rounds per player is the same for both groups.
In a third and fourth step, I ran a statistical test on the sum_of_purchases (using the z-test) and conversion (chi-squared test).
Results
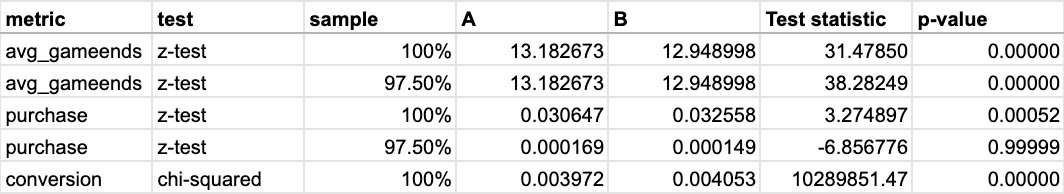
- Players in group A are significantly (p < α = 0.05) more engaged in terms of game rounds played than players from group B (this finding is robust to outliers)
- Therefore, the original version seems to provide the better game experience from a players’ perspective as they are engaging longer
- It is statistically significant (p < α = 0.05) that players in group B purchase more than players from group A. However, the result is not robust to extreme values
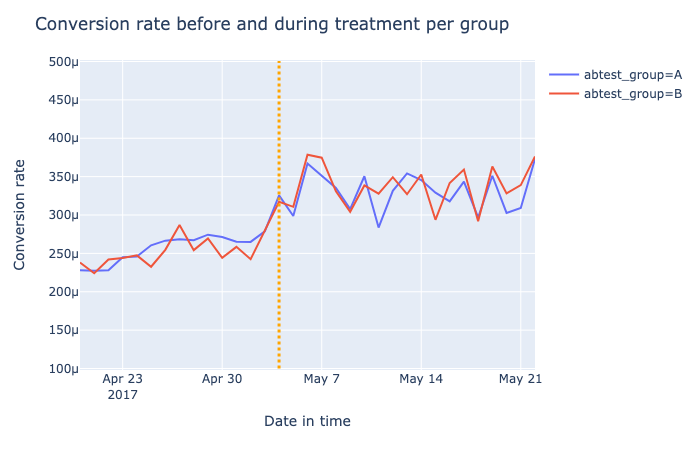
- Even though the CVR was higher for group B during the treatment time, it has not proven significant and players in group A and B convert equally likely
- The change in the game (version B) has not led players to convert significantly more
Recommendations
The recommendations I provided were twofold:
If the product strategy is to provide a better user experience, my recommendation would be to stick with version A.
If the product strategy is, however, to drive short-term revenue and drive people to buy more, I would recommend to go with version B. However, in the long-run, fewer and less-engaged players may lead to lower revenues.
Overall, for a product to be sustainably successful, long-term game engagement but also revenue should be a focus. I, therefore, recommended conducting further analysis before deciding for or against a specific version.
Source code
The code for this analysis can be found here.